Kaltura analytics
What does Kaltura Analytics mean for students and lecturers?
Anyone who uploads a video in Kaltura can see how this video is viewed using the Analytics function. This means that lecturers and students who are the Owner or Co-Editor of a video have insight into the viewing behaviour of the viewers on a global level, but the viewers themselves do not have that possibility.
For privacy reasons, the Analytics have been anonymised so that, for example, a teacher or a fellow student in a peer review assignment cannot review how often or for how long a video is viewed by an individual student and from which location.
The aggregated data that can be viewed at Analytics is briefly described below, for more details please see the detailed description below.
The global data that a teacher can review with Analytics are:
- how many people watched the video,
- what percentage of the video was watched by how many viewers,
- from which countries and cities, the video is viewed,
- which device the video was viewed on,
- and whether the video received Likes or was shared.
When the teacher uses the Video Quiz as an assignment the analytics contain your personal details, just for the goal to be able give a personal review. This is a common user-case and is conforming the GDPR regulations.
How to use Kaltura Analytics (lecturer & student)
Analytics provides information on viewer behaviour. It gives an insight into the engagement of students watching your video’s. This can help you understand when people stop watching and how effective your video is.
The Analytics can only be viewed by video owners, co-editors, channel owners and media gallery owners (the Courses) in Canvas. But viewers themselves, such as students, have no insight into their own viewing behaviour. Based on the GDPR guidelines, it is the intention that teachers inform students when and with which goal they use the Analytics functionality in their education, for example to review the results of a Video Quiz. The data of the Analytics are described below.
Where can you find the Analytics?
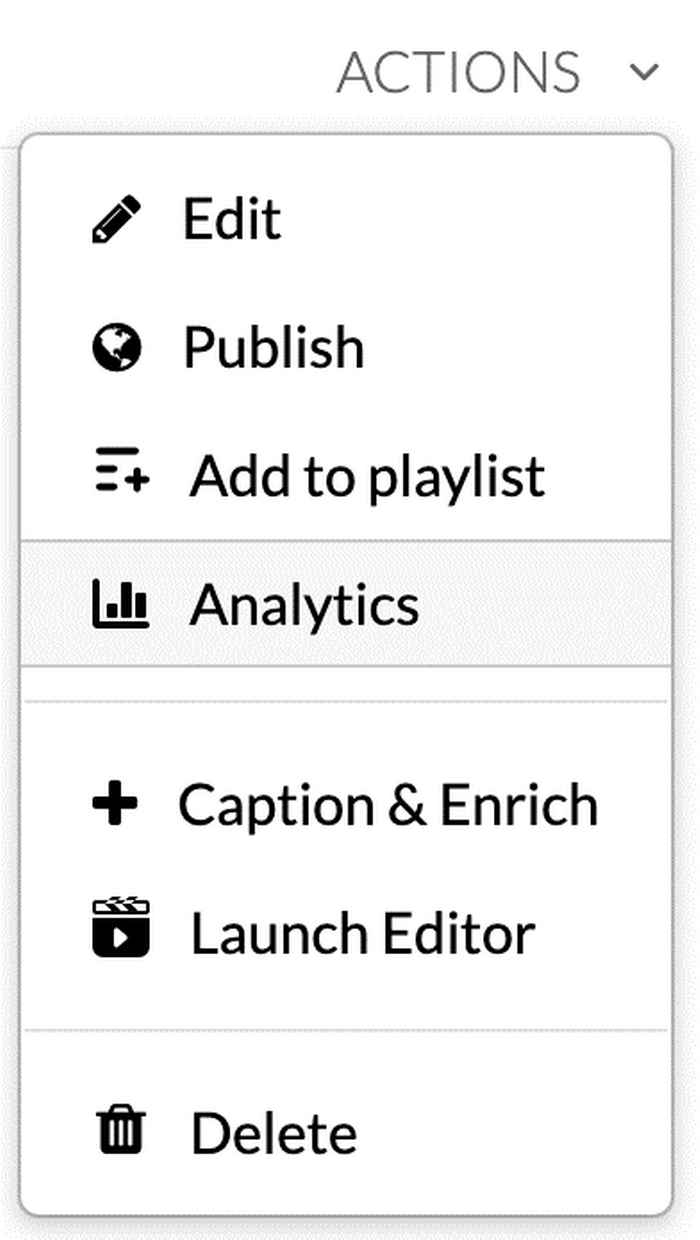
Open a video of which you are the owner or co-editor. Select Actions (on the bottom right of the video) and choose Analytics.
Settings
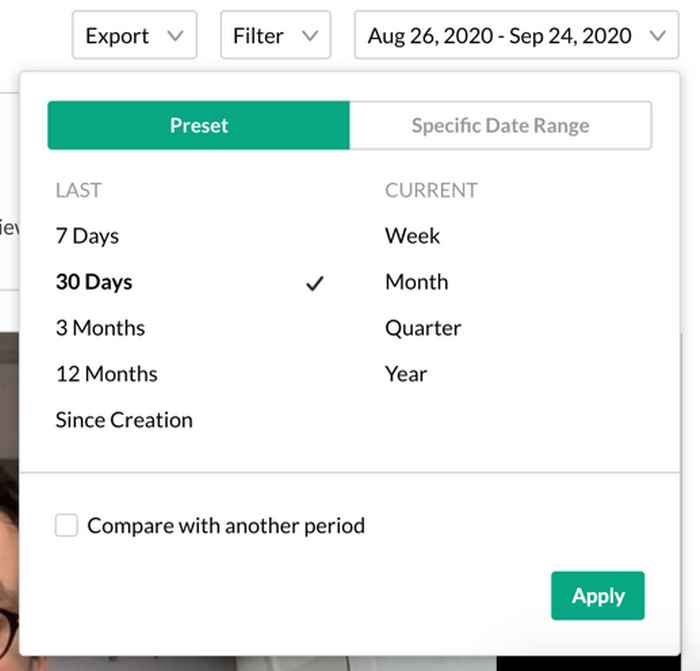
The analytics of the past 30 days will automatically be displayed, not counting the present day. You can change the timeframe by clicking on the dates on the top right of the menu.
With Filter, you can filter the analytics per country of the viewer.
With Export, you can export the analytics to your e-mail address. A link to the data is sent per e-mail. Note, this link will only be available for 24 hours after exportation, thereafter, the link will stop working.
Overview Analytics
On the top of the page an overview showing the analytics of your video is displayed:
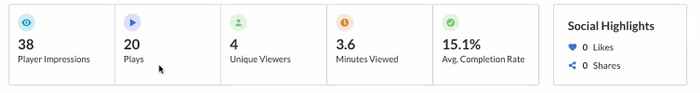
- Player Impressions: the number of times that the video (as a thumbnail) was loaded on a page (video is not played)
- Plays: the amount of views of the video
- Unique Viewers: the number of unique viewers that watched the video
- Minutes Viewed: the total amount of minutes that the video has been watched
- Avg. Completion Rate: a percentage of how much of the video is being watched
Social Highlights show the number of people that liked your video (Likes) and the number of people that shared your video with others (Shares).
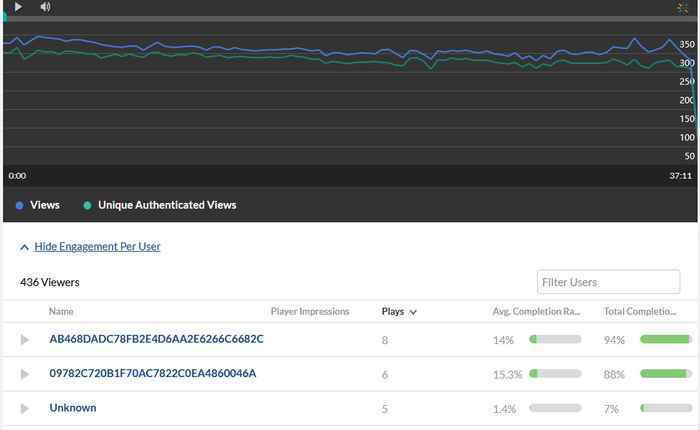
In the timeline underneath the video, you can see 1) the total amount of viewers, and 2) the unique amount of viewers, for each specific moment in time.
The analytics per viewer can also be seen in this menu, click on Hide engagement per viewer. The same analytics appear but categorized per viewer. Note, due to privacy policy the viewers are anonymized and cannot be traced by the owner of the video (or anyone else). In line with the GDPR legislation, assessments cannot and may not be based solely on this automated data. The viewing behavior displayed alone does not say anything about the reasons why a viewer watches a video several times. Only in the context of a Video Quiz, it is therefore possible as a teacher to view the quiz scores per individual viewer and thus also a student.
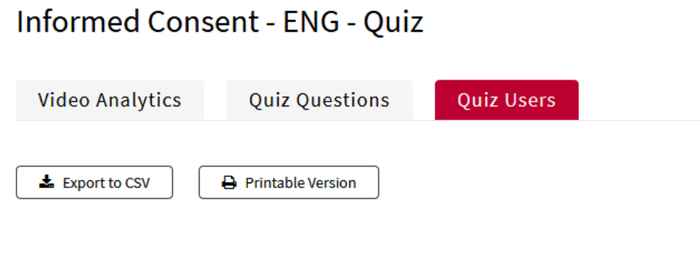
Video Quiz
The teacher is able to view the results of a viewer from a Video Quiz in Canvas and the Portal: video.uva.nl.
Results from viewers in Grade Book in Canvas

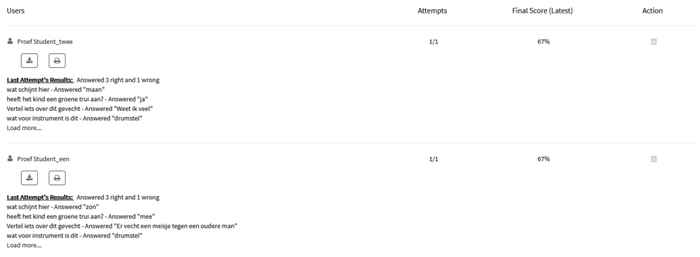
The Video Quiz can be created as an assignment therefore the individual results of the viewer are connected through the Grade Book in Canvas. Questions with open answers are not visible in the Grade book. The answers can be reviewed in the Analytics section of the Video Quizz in Kaltura
Results in the Portal: video.uva.nl
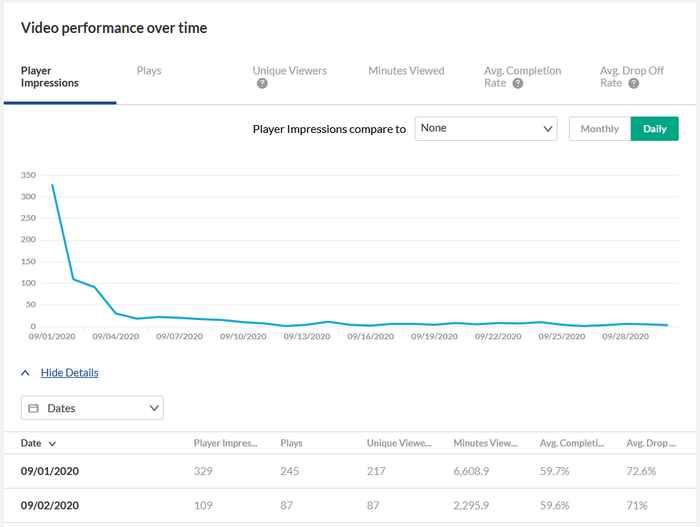
Video performance over time
The menu Video performance over time shows a more detailed version of the analytics overview at the top of the page. The analytics shown in this menu are specific to a moment in time. In addition, this menu also shows the Average drop off rate. This rate shows the average percentage when viewers stopped watching the video.
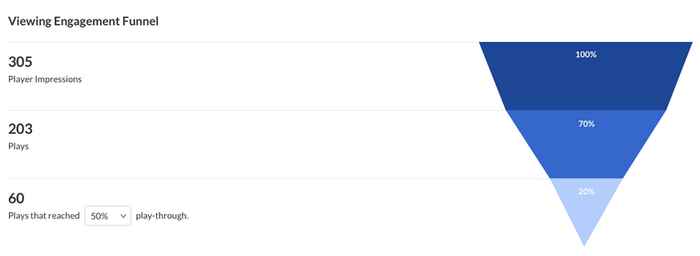
How player impressions lead to engagement
The engagement funnel shows viewer behavior. It compares how many people encountered the video (Player impressions), to how many people watched the video (Plays), and to how many people played an X percentage of the video (Play-through). In short, the following metrics are shown in the funnel:
- Player impressions: the number of times that the video (as a thumbnail) was loaded on a page (video is not played)
- Plays: the amount of views of the video
- Plays that reached … play-through: How many viewers have seen X percentages of the video (this can be selected by the user).
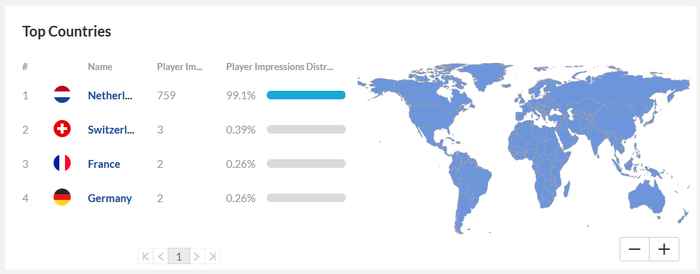
Top Countries
The Top Countries menu shows the Plays and the Player Impressions per country. The heatmap shows the countries, the darker the shade, the more plays for that country. You can view more specifically by selecting a region or city by clicking on a country on the map.
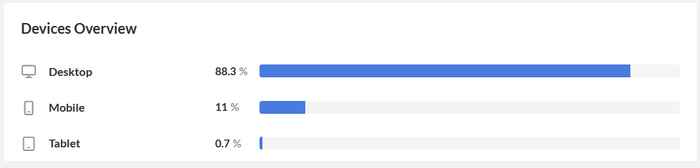
Devices Overview
Devices overview displays the distribution of devices used to watch the video. You can see on which device the viewers watched your video.
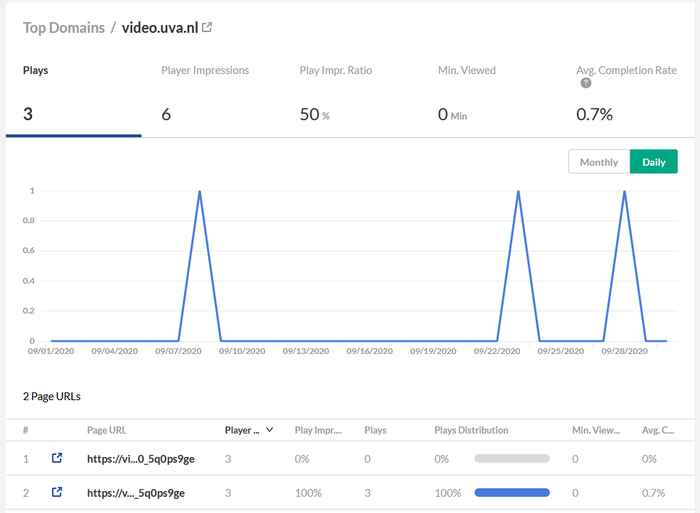
Top Domains
In top domains you can see from which domain you videos are being accessed, this can either be canvas or video.uva.nl. For each domain the following metrics are available:
- Plays: the amount of views of the video
- Player impressions: the number of times that the video (as a thumbnail) was loaded on a page (video is not played)
- Player impression ratio: the number of plays divided by the number of impressions
- Minutes viewed: total amount of minutes viewed of the video
- Average completion rate: the average percentage viewed of the video
Viewing Analytics for a Canvas Course or MediaSpace Channel
Viewing Analytics of a Canvas Course or Channel are possible. From these Analytics you are able to see how long viewers have watched the video and which of the media items are most popular. Below are the steps for how to view the Analytics for a Canvas course or Channel.
1) Go to the Media Gallery of the specific Canvas Course or Channel
2) In the upper right from the Media Gallery/ Channel there is a dropdown menu, select Analytics
Note: Only the Media Gallery/ Channel manager is able to view the Analytics for a Canvas Course/ MediaSpace Channel